1.5 The Graph of a Linear Function
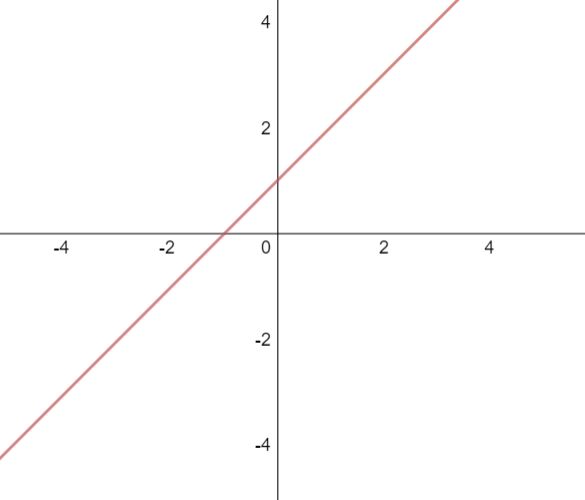
The functions like  are called linear functions. It easy to understand why it’s named like this: the graph of the function is, simply, a line like the picture below.

The m here, is called the slope. If we assume that the angel between the line and the x axis is q. Then the slope of the line is  .
.
There are 3 common ways to identify a line. One way is called intercept-slope formula:  . Another way is point-slope formula: if we know that the line passes the point
  , and the slope is m, so the formula is:
  . The third way is used when you don’t know the slope. So first, you should calculate the slope of the line. If you know that the line passes point
  and point
  , then we know that its slope is
  , then we use the former ways to get the formula of the function.
This post belongs to Column 「Notes for Calculus Life Saver」 .
 Miki_Sayaka
Admin Author 2021-04-21T13:08:01Z明天就要考数学了,发个应景点的
 Miki_Sayaka
Admin Author 2021-04-21T13:12:10Z估计下一期的会非常长(因为书上的篇幅就有好几页)(所以说想要我分成几期发出来的扣个1,不想的扣个2,谢谢配合)
 CXL
CXL
Admin 2021-04-22T05:46:25Z1
Deleted Flog User
2021-04-22T09:09:24Z估计下一期的会非常长(因为书上的篇幅就有好几页)(所以说想要我分成几期发出来的扣个1,不想的扣个2,谢谢配合)
1
 Miki_Sayaka
Admin Author 2021-04-28T12:53:33Z1
鉴于同志们都想要我分期发,那我下一次就先发一部分咯